问题描述
2015年8月摘要
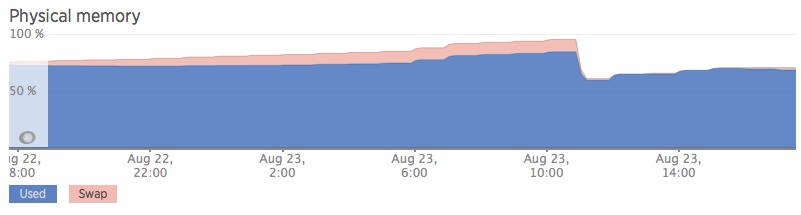
请注意,这仍在发生。这与linuxatemyram.com不相关-内存不用于磁盘高速缓存/缓冲区。这就是NewRelic中的样子-系统泄漏所有内存,用尽所有交换空间,然后崩溃。在此屏幕快照中,我在服务器崩溃之前重新启动了服务器:
使用通用的用户空间工具无法确定泄漏源。现在有一个讨论此问题的聊天室:http://chat.stackexchange.com/rooms/27309/invisible-memory-leak-on-linux
恢复”missing”内存的唯一方法似乎是重新引导服务器。这是在Ubuntu Server 14.04、14.10和15.04中长期存在的问题。
Top
内存使用不会排在最前面,即使杀死几乎每个进程(不包括内核进程和ssh之类),也无法恢复。在顶部查看”cached Mem”,”buffers”和”free”字段,它们没有用完内存,所用的内存是”missing”,并且无法重新启动就无法恢复。
尝试使用此”missing”内存会导致服务器交换,缓慢进行爬网并最终冻结。
root@XanBox:~# top -o +%MEM
top - 12:12:13 up 15 days, 20:39,  3 users,  load average: 0.00, 0.06, 0.77
Tasks: 126 total,   1 running, 125 sleeping,   0 stopped,   0 zombie
%Cpu(s):  0.1 us,  0.2 sy,  0.0 ni, 99.7 id,  0.0 wa,  0.1 hi,  0.0 si,  0.0 st
KiB Mem:   2,040,256 total,  1,881,228 used,    159,028 free,     1,348 buffers
KiB Swap:  1,999,868 total,     27,436 used,  1,972,432 free.    67,228 cached Mem

  PID USER      PR  NI    VIRT    RES    SHR S  %CPU %MEM     TIME+ COMMAND
11502 root      20   0  107692   4252   3240 S   0.0  0.2   0:00.06 sshd: deployer [priv]
11336 root      20   0  107692   4248   3240 S   0.0  0.2   0:00.06 sshd: deployer [priv]
11841 root      20   0  107692   4248   3240 S   0.0  0.2   0:00.06 sshd: deployer [priv]
11301 root      20   0   26772   3436   2688 S   0.7  0.2   0:01.30 /usr/sbin/openvpn --writepid /var/run/openvpn.zanview.com.pid --status /var/run/openvpn.zanview.com.status 10 --cd /etc/openvpn --config /etc/openvpn/z+
11385 deployer  20   0   19972   2392   1708 S   0.0  0.1   0:00.03 -bash
11553 deployer  20   0   19972   2388   1708 S   0.0  0.1   0:00.03 -bash
11890 deployer  20   0   19972   2388   1708 S   0.0  0.1   0:00.02 -bash
11889 deployer  20   0  108008   2280    944 S   0.0  0.1   0:00.25 sshd: deployer@pts/3
12009 root      20   0   18308   2228   1608 S   0.0  0.1   0:00.09 -su
12114 root      20   0   18308   2192   1564 S   0.0  0.1   0:00.04 -su
12007 root      20   0   67796   2136   1644 S   0.0  0.1   0:00.01 sudo su -
12112 root      20   0   67796   2136   1644 S   0.0  0.1   0:00.01 sudo su -
12008 root      20   0   67376   2016   1528 S   0.0  0.1   0:00.01 su -
12113 root      20   0   67376   2012   1528 S   0.0  0.1   0:00.01 su -
    1 root      20   0   33644   1988    764 S   0.0  0.1   2:29.77 /sbin/init
11552 deployer  20   0  107692   1952    936 S   0.0  0.1   0:00.07 sshd: deployer@pts/2
11384 deployer  20   0  107692   1948    936 S   0.0  0.1   0:00.06 sshd: deployer@pts/0
12182 root      20   0   20012   1516   1012 R   0.7  0.1   0:00.08 top -o +%MEM
 1152 message+  20   0   39508   1448    920 S   0.0  0.1   1:40.01 dbus-daemon --system --fork
 1791 root      20   0  279832   1312    816 S   0.0  0.1   1:16.18 /usr/lib/policykit-1/polkitd --no-debug
 1186 root      20   0   43736    984    796 S   0.0  0.0   1:13.07 /lib/systemd/systemd-logind
 1212 syslog    20   0  256228    688    184 S   0.0  0.0   1:41.29 rsyslogd
 5077 root      20   0   25324    648    520 S   0.0  0.0   0:34.35 /usr/sbin/hostapd -B -P /var/run/hostapd.pid /etc/hostapd/hostapd.conf
  336 root      20   0   19476    512    376 S   0.0  0.0   0:07.40 upstart-udev-bridge --daemon
  342 root      20   0   51228    468    344 S   0.0  0.0   0:00.85 /lib/systemd/systemd-udevd --daemon
 1097 root      20   0   15276    364    256 S   0.0  0.0   0:06.39 upstart-file-bridge --daemon
 4921 root      20   0   61364    364    240 S   0.0  0.0   0:00.05 /usr/sbin/sshd -D
  745 root      20   0   15364    252    180 S   0.0  0.0   0:06.51 upstart-socket-bridge --daemon
 4947 root      20   0   23656    168    100 S   0.0  0.0   0:14.70 cron
11290 daemon    20   0   19140    164      0 S   0.0  0.0   0:00.00 atd
  850 root      20   0   23420     80     16 S   0.0  0.0   0:11.00 rpcbind
  872 statd     20   0   21544      8      4 S   0.0  0.0   0:00.00 rpc.statd -L
 4880 root      20   0   14540      4      0 S   0.0  0.0   0:00.00 /sbin/getty -8 38400 tty4
 4883 root      20   0   14540      4      0 S   0.0  0.0   0:00.00 /sbin/getty -8 38400 tty5
 4890 root      20   0   14540      4      0 S   0.0  0.0   0:00.00 /sbin/getty -8 38400 tty2
 4891 root      20   0   14540      4      0 S   0.0  0.0   0:00.00 /sbin/getty -8 38400 tty3
 4894 root      20   0   14540      4      0 S   0.0  0.0   0:00.00 /sbin/getty -8 38400 tty6
 4919 root      20   0    4368      4      0 S   0.0  0.0   0:00.00 acpid -c /etc/acpi/events -s /var/run/acpid.socket
 5224 root      20   0   24048      4      0 S   0.0  0.0   0:00.00 /usr/sbin/rpc.mountd --manage-gids
 6160 root      20   0   14540      4      0 S   0.0  0.0   0:00.00 /sbin/getty -8 38400 tty1
    2 root      20   0       0      0      0 S   0.0  0.0   0:03.44 [kthreadd]
    3 root      20   0       0      0      0 S   0.0  0.0   1:04.63 [ksoftirqd/0]
    5 root       0 -20       0      0      0 S   0.0  0.0   0:00.00 [kworker/0:0H]
    7 root      20   0       0      0      0 S   0.0  0.0  16:03.32 [rcu_sched]
    8 root      20   0       0      0      0 S   0.0  0.0   4:08.79 [rcuos/0]
    9 root      20   0       0      0      0 S   0.0  0.0   4:10.42 [rcuos/1]
   10 root      20   0       0      0      0 S   0.0  0.0   4:30.71 [rcuos/2]
Hardware
到目前为止,我已经在300台服务器中的3台服务器上观察到了这一点(尽管其他服务器可能会受到影响)。一个是Intel Atom D525 @ 1.8ghz,另外两个是Core2Duo E4600和Q6600。一种使用JMicron Technology Corp.的JMC250 PCI Express千兆以太网控制器,另一种使用Qualcomm Atheros Attansic L1千兆以太网(rev b0)。
我在故障服务器以及示例OK服务器上都运行了lshw。问题服务器:http://pastie.org/10370534 http://pastie.org/10370537和http://pastie.org/10370541-确定服务器:http://pastie.org/10370544
Application
这是一个完全没有头的应用程序。没有连接监视器,实际上根本没有安装XServer。这应该排除图形驱动程序/问题。
该服务器用于使用live555ProxyServer,ffmpeg和openCV代理和分析RTSP视频。这些服务器确实处理大量流量,因为这是CCTV应用程序:http://pastie.org/9558324
我尝试了live555,ffmpeg和openCV的非常老和最新的主干版本,而没有进行更改。我也尝试通过python2和python3模块使用opencv,没有任何变化。
完全相同的软件/配置已加载到接近100台服务器上,到目前为止,已确认3台泄漏了内存。服务器每小时缓慢地偷偷地泄漏大约xMB(一个泄漏8MB,一个泄漏较慢,一个泄漏更快),直到所有内存都消失了,服务器开始大量交换,缓慢进行爬网并需要重新启动。
Meminfo
同样,您可以看到“缓存”和“缓冲区”根本没有用完太多内存。 HugePages也被禁用,因此这不是罪魁祸首。
root@XanBox:~# cat /proc/meminfo
MemTotal:          2,040,256 kB
MemFree:             159,004 kB
Buffers:               1,348 kB
Cached:               67,228 kB
SwapCached:            9,940 kB
Active:               10,788 kB
Inactive:             81,120 kB
Active(anon):          1,900 kB
Inactive(anon):       21,512 kB
Active(file):          8,888 kB
Inactive(file):       59,608 kB
Unevictable:               0 kB
Mlocked:                   0 kB
SwapTotal:         1,999,868 kB
SwapFree:          1,972,432 kB
Dirty:                     0 kB
Writeback:                 0 kB
AnonPages:            14,496 kB
Mapped:                8,160 kB
Shmem:                    80 kB
Slab:                 33,472 kB
SReclaimable:         17,660 kB
SUnreclaim:           15,812 kB
KernelStack:           1,064 kB
PageTables:            3,992 kB
NFS_Unstable:              0 kB
Bounce:                    0 kB
WritebackTmp:              0 kB
CommitLimit:       3,019,996 kB
Committed_AS:         94,520 kB
VmallocTotal: 34,359,738,367 kB
VmallocUsed:         535,936 kB
VmallocChunk: 34,359,147,772 kB
HardwareCorrupted:         0 kB
AnonHugePages:             0 kB
HugePages_Total:           0
HugePages_Free:            0
HugePages_Rsvd:            0
HugePages_Surp:            0
Hugepagesize:          2,048 kB
DirectMap4k:          62,144 kB
DirectMap2M:       2,025,472 kB
自由输出
Free显示以下内容(请注意,缓存和缓冲区都很低,因此这不是磁盘缓存或缓冲区!)-内存必须重新启动才能恢复:
root@XanBox:~# free -m
             total       used       free     shared    buffers     cached
Mem:         1,992      1,838        153          0          1         66
如果我们将缓冲区/缓存减去/添加到“已使用”和“空闲”,我们将看到:
-
实际使用的1,772MB(-缓冲区/缓存)=已使用的1,838MB-1MB缓冲区-66MB缓存
-
220MB真正可用(+缓冲区/缓存)= 154MB可用+ 1MB缓冲区+ 66MB缓存
完全符合我们的预期:
-/+ buffers/cache: 1,772 220
因此,用户空间未使用约1.7GB的空间,实际上内核已使用了约1.7GB的空间,因为系统实际上使用了53.7MB(请参见下面的PS Mem输出)。
我对1.7GB用于缓存/缓冲区的评论数量感到惊讶,这基本上是对输出的误读! -此行表示已用内存,不包括缓冲区/高速缓存,有关详细信息,请参见linuxatemyram.com。
PS输出
这是按内存排序的正在运行的进程的完整列表:
# ps -e -o pid,vsz,comm= | sort -n -k 2
    2      0 kthreadd
    3      0 ksoftirqd/0
    5      0 kworker/0:0H
    7      0 rcu_sched
    8      0 rcuos/0
    9      0 rcuos/1
   10      0 rcuos/2
   11      0 rcuos/3
   12      0 rcu_bh
   13      0 rcuob/0
   14      0 rcuob/1
   15      0 rcuob/2
   16      0 rcuob/3
   17      0 migration/0
   18      0 watchdog/0
   19      0 watchdog/1
   20      0 migration/1
   21      0 ksoftirqd/1
   23      0 kworker/1:0H
   24      0 watchdog/2
   25      0 migration/2
   26      0 ksoftirqd/2
   28      0 kworker/2:0H
   29      0 watchdog/3
   30      0 migration/3
   31      0 ksoftirqd/3
   32      0 kworker/3:0
   33      0 kworker/3:0H
   34      0 khelper
   35      0 kdevtmpfs
   36      0 netns
   37      0 writeback
   38      0 kintegrityd
   39      0 bioset
   41      0 kblockd
   42      0 ata_sff
   43      0 khubd
   44      0 md
   45      0 devfreq_wq
   46      0 kworker/0:1
   47      0 kworker/1:1
   48      0 kworker/2:1
   50      0 khungtaskd
   51      0 kswapd0
   52      0 ksmd
   53      0 khugepaged
   54      0 fsnotify_mark
   55      0 ecryptfs-kthrea
   56      0 crypto
   68      0 kthrotld
   70      0 scsi_eh_0
   71      0 scsi_eh_1
   92      0 deferwq
   93      0 charger_manager
   94      0 kworker/1:2
   95      0 kworker/3:2
  149      0 kpsmoused
  155      0 jbd2/sda1-8
  156      0 ext4-rsv-conver
  316      0 jbd2/sda3-8
  317      0 ext4-rsv-conver
  565      0 kmemstick
  770      0 cfg80211
  818      0 hd-audio0
  853      0 kworker/2:2
  953      0 rpciod
  PID    VSZ
 1714      0 kauditd
11335      0 kworker/0:2
12202      0 kworker/u8:2
20228      0 kworker/u8:0
25529      0 kworker/u9:1
28305      0 kworker/u9:2
29822      0 lockd
 4919   4368 acpid
 4074   7136 ps
 6681  10232 dhclient
 4880  14540 getty
 4883  14540 getty
 4890  14540 getty
 4891  14540 getty
 4894  14540 getty
 6160  14540 getty
14486  15260 upstart-socket-
14489  15276 upstart-file-br
12009  18308 bash
12114  18308 bash
12289  18308 bash
 4075  19008 sort
11290  19140 atd
14483  19476 upstart-udev-br
11385  19972 bash
11553  19972 bash
11890  19972 bash
29503  21544 rpc.statd
 2847  23384 htop
  850  23420 rpcbind
29588  23480 rpc.idmapd
 4947  23656 cron
29833  24048 rpc.mountd
 5077  25324 hostapd
11301  26912 openvpn
    1  37356 init
 1152  39508 dbus-daemon
14673  43452 systemd-logind
14450  51204 systemd-udevd
 4921  61364 sshd
12008  67376 su
12113  67376 su
12288  67376 su
12007  67796 sudo
12112  67796 sudo
12287  67796 sudo
11336 107692 sshd
11384 107692 sshd
11502 107692 sshd
11841 107692 sshd
11552 108008 sshd
11889 108008 sshd
 1212 256228 rsyslogd
 1791 279832 polkitd
 4064 335684 whoopsie
这是所有正在运行的进程的完整列表:
root@XanBox:~# ps aux
USER       PID %CPU %MEM    VSZ   RSS TTY      STAT START   TIME COMMAND
root         1  0.0  0.0  33644  1988 ?        Ss   Jul21   2:29 /sbin/init
root         2  0.0  0.0      0     0 ?        S    Jul21   0:03 [kthreadd]
root         3  0.0  0.0      0     0 ?        S    Jul21   1:04 [ksoftirqd/0]
root         5  0.0  0.0      0     0 ?        S<   Jul21   0:00 [kworker/0:0H]
root         7  0.0  0.0      0     0 ?        S    Jul21  16:03 [rcu_sched]
root         8  0.0  0.0      0     0 ?        S    Jul21   4:08 [rcuos/0]
root         9  0.0  0.0      0     0 ?        S    Jul21   4:10 [rcuos/1]
root        10  0.0  0.0      0     0 ?        S    Jul21   4:30 [rcuos/2]
root        11  0.0  0.0      0     0 ?        S    Jul21   4:28 [rcuos/3]
root        12  0.0  0.0      0     0 ?        S    Jul21   0:00 [rcu_bh]
root        13  0.0  0.0      0     0 ?        S    Jul21   0:00 [rcuob/0]
root        14  0.0  0.0      0     0 ?        S    Jul21   0:00 [rcuob/1]
root        15  0.0  0.0      0     0 ?        S    Jul21   0:00 [rcuob/2]
root        16  0.0  0.0      0     0 ?        S    Jul21   0:00 [rcuob/3]
root        17  0.0  0.0      0     0 ?        S    Jul21   0:13 [migration/0]
root        18  0.0  0.0      0     0 ?        S    Jul21   0:08 [watchdog/0]
root        19  0.0  0.0      0     0 ?        S    Jul21   0:07 [watchdog/1]
root        20  0.0  0.0      0     0 ?        S    Jul21   0:13 [migration/1]
root        21  0.0  0.0      0     0 ?        S    Jul21   1:03 [ksoftirqd/1]
root        23  0.0  0.0      0     0 ?        S<   Jul21   0:00 [kworker/1:0H]
root        24  0.0  0.0      0     0 ?        S    Jul21   0:07 [watchdog/2]
root        25  0.0  0.0      0     0 ?        S    Jul21   0:23 [migration/2]
root        26  0.0  0.0      0     0 ?        S    Jul21   1:01 [ksoftirqd/2]
root        28  0.0  0.0      0     0 ?        S<   Jul21   0:00 [kworker/2:0H]
root        29  0.0  0.0      0     0 ?        S    Jul21   0:07 [watchdog/3]
root        30  0.0  0.0      0     0 ?        S    Jul21   0:23 [migration/3]
root        31  0.0  0.0      0     0 ?        S    Jul21   1:03 [ksoftirqd/3]
root        32  0.0  0.0      0     0 ?        S    Jul21   0:00 [kworker/3:0]
root        33  0.0  0.0      0     0 ?        S<   Jul21   0:00 [kworker/3:0H]
root        34  0.0  0.0      0     0 ?        S<   Jul21   0:00 [khelper]
root        35  0.0  0.0      0     0 ?        S    Jul21   0:00 [kdevtmpfs]
root        36  0.0  0.0      0     0 ?        S<   Jul21   0:00 [netns]
root        37  0.0  0.0      0     0 ?        S<   Jul21   0:00 [writeback]
root        38  0.0  0.0      0     0 ?        S<   Jul21   0:00 [kintegrityd]
root        39  0.0  0.0      0     0 ?        S<   Jul21   0:00 [bioset]
root        41  0.0  0.0      0     0 ?        S<   Jul21   0:00 [kblockd]
root        42  0.0  0.0      0     0 ?        S<   Jul21   0:00 [ata_sff]
root        43  0.0  0.0      0     0 ?        S    Jul21   0:00 [khubd]
root        44  0.0  0.0      0     0 ?        S<   Jul21   0:00 [md]
root        45  0.0  0.0      0     0 ?        S<   Jul21   0:00 [devfreq_wq]
root        46  0.0  0.0      0     0 ?        S    Jul21  18:51 [kworker/0:1]
root        47  0.0  0.0      0     0 ?        S    Jul21   0:00 [kworker/1:1]
root        48  0.0  0.0      0     0 ?        S    Jul21   1:14 [kworker/2:1]
root        50  0.0  0.0      0     0 ?        S    Jul21   0:01 [khungtaskd]
root        51  0.4  0.0      0     0 ?        S    Jul21  95:51 [kswapd0]
root        52  0.0  0.0      0     0 ?        SN   Jul21   0:00 [ksmd]
root        53  0.0  0.0      0     0 ?        SN   Jul21   0:28 [khugepaged]
root        54  0.0  0.0      0     0 ?        S    Jul21   0:00 [fsnotify_mark]
root        55  0.0  0.0      0     0 ?        S    Jul21   0:00 [ecryptfs-kthrea]
root        56  0.0  0.0      0     0 ?        S<   Jul21   0:00 [crypto]
root        68  0.0  0.0      0     0 ?        S<   Jul21   0:00 [kthrotld]
root        70  0.0  0.0      0     0 ?        S    Jul21   0:00 [scsi_eh_0]
root        71  0.0  0.0      0     0 ?        S    Jul21   0:00 [scsi_eh_1]
root        92  0.0  0.0      0     0 ?        S<   Jul21   0:00 [deferwq]
root        93  0.0  0.0      0     0 ?        S<   Jul21   0:00 [charger_manager]
root        94  0.0  0.0      0     0 ?        S    Jul21   1:05 [kworker/1:2]
root        95  0.0  0.0      0     0 ?        S    Jul21   1:08 [kworker/3:2]
root       149  0.0  0.0      0     0 ?        S<   Jul21   0:00 [kpsmoused]
root       155  0.0  0.0      0     0 ?        S    Jul21   3:39 [jbd2/sda1-8]
root       156  0.0  0.0      0     0 ?        S<   Jul21   0:00 [ext4-rsv-conver]
root       316  0.0  0.0      0     0 ?        S    Jul21   1:28 [jbd2/sda3-8]
root       317  0.0  0.0      0     0 ?        S<   Jul21   0:00 [ext4-rsv-conver]
root       336  0.0  0.0  19476   512 ?        S    Jul21   0:07 upstart-udev-bridge --daemon
root       342  0.0  0.0  51228   468 ?        Ss   Jul21   0:00 /lib/systemd/systemd-udevd --daemon
root       565  0.0  0.0      0     0 ?        S<   Jul21   0:00 [kmemstick]
root       745  0.0  0.0  15364   252 ?        S    Jul21   0:06 upstart-socket-bridge --daemon
root       770  0.0  0.0      0     0 ?        S<   Jul21   0:00 [cfg80211]
root       818  0.0  0.0      0     0 ?        S<   Jul21   0:00 [hd-audio0]
root       850  0.0  0.0  23420    80 ?        Ss   Jul21   0:11 rpcbind
root       853  0.0  0.0      0     0 ?        S    Jul21   0:00 [kworker/2:2]
statd      872  0.0  0.0  21544     8 ?        Ss   Jul21   0:00 rpc.statd -L
root       953  0.0  0.0      0     0 ?        S<   Jul21   0:00 [rpciod]
root      1097  0.0  0.0  15276   364 ?        S    Jul21   0:06 upstart-file-bridge --daemon
message+  1152  0.0  0.0  39508  1448 ?        Ss   Jul21   1:40 dbus-daemon --system --fork
root      1157  0.0  0.0  23480     0 ?        Ss   Jul21   0:00 rpc.idmapd
root      1186  0.0  0.0  43736   984 ?        Ss   Jul21   1:13 /lib/systemd/systemd-logind
syslog    1212  0.0  0.0 256228   688 ?        Ssl  Jul21   1:41 rsyslogd
root      1714  0.0  0.0      0     0 ?        S    Jul21   0:00 [kauditd]
root      1791  0.0  0.0 279832  1312 ?        Sl   Jul21   1:16 /usr/lib/policykit-1/polkitd --no-debug
root      4880  0.0  0.0  14540     4 tty4     Ss+  Jul21   0:00 /sbin/getty -8 38400 tty4
root      4883  0.0  0.0  14540     4 tty5     Ss+  Jul21   0:00 /sbin/getty -8 38400 tty5
root      4890  0.0  0.0  14540     4 tty2     Ss+  Jul21   0:00 /sbin/getty -8 38400 tty2
root      4891  0.0  0.0  14540     4 tty3     Ss+  Jul21   0:00 /sbin/getty -8 38400 tty3
root      4894  0.0  0.0  14540     4 tty6     Ss+  Jul21   0:00 /sbin/getty -8 38400 tty6
root      4919  0.0  0.0   4368     4 ?        Ss   Jul21   0:00 acpid -c /etc/acpi/events -s /var/run/acpid.socket
root      4921  0.0  0.0  61364   364 ?        Ss   Jul21   0:00 /usr/sbin/sshd -D
root      4947  0.0  0.0  23656   168 ?        Ss   Jul21   0:14 cron
root      5077  0.0  0.0  25324   648 ?        Ss   Jul21   0:34 /usr/sbin/hostapd -B -P /var/run/hostapd.pid /etc/hostapd/hostapd.conf
root      5192  0.0  0.0      0     0 ?        S    Jul21   0:00 [lockd]
root      5224  0.0  0.0  24048     4 ?        Ss   Jul21   0:00 /usr/sbin/rpc.mountd --manage-gids
root      6160  0.0  0.0  14540     4 tty1     Ss+  Jul21   0:00 /sbin/getty -8 38400 tty1
root      6681  0.0  0.0  10232     0 ?        Ss   11:07   0:00 dhclient -1 -v -pf /run/dhclient.eth0.pid -lf /var/lib/dhcp/dhclient.eth0.leases eth0
root      9452  0.0  0.0      0     0 ?        S    11:28   0:00 [kworker/u8:1]
root      9943  0.0  0.0      0     0 ?        S    11:42   0:00 [kworker/u8:0]
daemon   11290  0.0  0.0  19140   164 ?        Ss   11:59   0:00 atd
root     11301  0.2  0.1  26772  3436 ?        Ss   12:00   0:01 /usr/sbin/openvpn --writepid /var/run/openvpn.zanview.com.pid --status /var/run/openvpn.zanview.com.status 10 --cd /etc/openvpn --config /etc/openvpn/zanvie
root     11335  0.0  0.0      0     0 ?        S    12:01   0:00 [kworker/0:2]
root     11336  0.0  0.2 107692  4248 ?        Ss   12:01   0:00 sshd: deployer [priv]
deployer 11384  0.0  0.0 107692  1948 ?        S    12:01   0:00 sshd: deployer@pts/0
deployer 11385  0.0  0.1  19972  2392 pts/0    Ss+  12:01   0:00 -bash
root     11502  0.0  0.2 107692  4252 ?        Ss   12:01   0:00 sshd: deployer [priv]
deployer 11552  0.0  0.0 107692  1952 ?        S    12:01   0:00 sshd: deployer@pts/2
deployer 11553  0.0  0.1  19972  2388 pts/2    Ss   12:01   0:00 -bash
root     11841  0.0  0.2 107692  4248 ?        Ss   12:02   0:00 sshd: deployer [priv]
deployer 11889  0.0  0.1 108008  2280 ?        S    12:02   0:00 sshd: deployer@pts/3
deployer 11890  0.0  0.1  19972  2388 pts/3    Ss   12:02   0:00 -bash
root     12007  0.0  0.1  67796  2136 pts/3    S    12:02   0:00 sudo su -
root     12008  0.0  0.0  67376  2016 pts/3    S    12:02   0:00 su -
root     12009  0.0  0.1  18308  2228 pts/3    S+   12:02   0:00 -su
root     12112  0.0  0.1  67796  2136 pts/2    S    12:08   0:00 sudo su -
root     12113  0.0  0.0  67376  2012 pts/2    S    12:08   0:00 su -
root     12114  0.0  0.1  18308  2192 pts/2    S    12:08   0:00 -su
root     12180  0.0  0.0  15568  1160 pts/2    R+   12:09   0:00 ps aux
root     25529  0.0  0.0      0     0 ?        S<   Jul28   0:09 [kworker/u9:1]
root     28305  0.0  0.0      0     0 ?        S<   Aug05   0:00 [kworker/u9:2]
PS Mem输出
我还尝试了https://github.com/pixelb/ps_mem的ps_mem.py
root@XanBox:~/ps_mem# python ps_mem.py
 Private  +   Shared  =  RAM used   Program

144.0 KiB +   9.5 KiB = 153.5 KiB   acpid
172.0 KiB +  29.5 KiB = 201.5 KiB   atd
248.0 KiB +  35.0 KiB = 283.0 KiB   cron
272.0 KiB +  84.0 KiB = 356.0 KiB   upstart-file-bridge
276.0 KiB +  84.5 KiB = 360.5 KiB   upstart-socket-bridge
280.0 KiB + 102.5 KiB = 382.5 KiB   upstart-udev-bridge
332.0 KiB +  54.5 KiB = 386.5 KiB   rpc.idmapd
368.0 KiB +  91.5 KiB = 459.5 KiB   rpcbind
388.0 KiB + 251.5 KiB = 639.5 KiB   systemd-logind
668.0 KiB +  43.5 KiB = 711.5 KiB   hostapd
576.0 KiB + 157.5 KiB = 733.5 KiB   systemd-udevd
676.0 KiB +  65.5 KiB = 741.5 KiB   rpc.mountd
604.0 KiB + 163.0 KiB = 767.0 KiB   rpc.statd
908.0 KiB +  62.5 KiB = 970.5 KiB   dbus-daemon [updated]
932.0 KiB + 117.0 KiB =   1.0 MiB   getty [updated] (6)
  1.0 MiB +  69.5 KiB =   1.1 MiB   openvpn
  1.0 MiB + 137.0 KiB =   1.2 MiB   polkitd
  1.5 MiB + 202.0 KiB =   1.7 MiB   htop
  1.4 MiB + 306.5 KiB =   1.7 MiB   whoopsie
  1.4 MiB + 279.0 KiB =   1.7 MiB   su (3)
  1.5 MiB + 268.5 KiB =   1.8 MiB   sudo (3)
  2.2 MiB +  11.5 KiB =   2.3 MiB   dhclient
  3.9 MiB + 741.0 KiB =   4.6 MiB   bash (6)
  5.3 MiB + 254.5 KiB =   5.5 MiB   init
  2.7 MiB +   3.3 MiB =   6.1 MiB   sshd (7)
 18.1 MiB +  56.5 KiB =  18.2 MiB   rsyslogd
---------------------------------
                         53.7 MiB
=================================
平板输出
我也尝试了slabtop:
root@XanBox:~# slabtop -sc
 Active / Total Objects (% used)    : 131306 / 137558 (95.5%)
 Active / Total Slabs (% used)      : 3888 / 3888 (100.0%)
 Active / Total Caches (% used)     : 63 / 105 (60.0%)
 Active / Total Size (% used)       : 27419.31K / 29580.53K (92.7%)
 Minimum / Average / Maximum Object : 0.01K / 0.21K / 8.00K

  OBJS ACTIVE  USE OBJ SIZE  SLABS OBJ/SLAB CACHE SIZE NAME
  8288   7975  96%    0.57K    296       28      4736K inode_cache
 14259  12858  90%    0.19K    679       21      2716K dentry
  2384   1943  81%    0.96K    149       16      2384K ext4_inode_cache
 20916  20494  97%    0.11K    581       36      2324K sysfs_dir_cache
   624    554  88%    2.00K     39       16      1248K kmalloc-2048
   195    176  90%    5.98K     39        5      1248K task_struct
  6447   6387  99%    0.19K    307       21      1228K kmalloc-192
  2128   1207  56%    0.55K     76       28      1216K radix_tree_node
   768    761  99%    1.00K     48       16       768K kmalloc-1024
   176    155  88%    4.00K     22        8       704K kmalloc-4096
  1100   1100 100%    0.63K     44       25       704K proc_inode_cache
  1008   1008 100%    0.66K     42       24       672K shmem_inode_cache
  2640   2262  85%    0.25K    165       16       660K kmalloc-256
   300    300 100%    2.06K     20       15       640K sighand_cache
  5967   5967 100%    0.10K    153       39       612K buffer_head
  1152   1053  91%    0.50K     72       16       576K kmalloc-512
  3810   3810 100%    0.13K    127       30       508K ext4_allocation_context
    60     60 100%    8.00K     15        4       480K kmalloc-8192
   225    225 100%    2.06K     15       15       480K idr_layer_cache
  7616   7324  96%    0.06K    119       64       476K kmalloc-64
   700    700 100%    0.62K     28       25       448K sock_inode_cache
   252    252 100%    1.75K     14       18       448K TCP
  8925   8544  95%    0.05K    105       85       420K shared_policy_node
  3072   2351  76%    0.12K     96       32       384K kmalloc-128
   360    360 100%    1.06K     12       30       384K signal_cache
   432    337  78%    0.88K     24       18       384K mm_struct
Other
我还尝试使用rkhunter扫描rootkit-它什么也没发现。我试图与缓存同步和转储:
sync; sync; sync; echo 3 > /proc/sys/vm/drop_caches
它也没有区别。
我还尝试通过以下方法强制交换或禁用交换:
sudo sysctl -w vm.swappiness=100
sudo swapoff /dev/sda2
我也尝试使用htop并按内存排序,但它也不显示内存的去向。内核版本是Linux 3.13.0-40,通用#69-Ubuntu SMP。
Dmesg输出:http://pastie.org/9558255 smem输出:http://pastie.org/9558290
结论
到底是怎么回事? -所有的 memory 都在哪里? -我怎么知道?
最佳办法
我的结论是,这是Linux内核中某处的内核内存泄漏,这就是为什么没有一个用户空间工具能够显示内存泄漏的原因。也许与此问题有关:https://serverfault.com/questions/670423/linux-memory-usage-higher-than-sum-of-processes
我将内核版本从3.13升级到3.19,看来内存泄漏已停止! -如果再次发现泄漏,我会报告。
拥有一些简单/便捷的方法来查看Linux内核的不同部分使用了多少内存仍然很有用。导致3.13泄漏的原因仍然是个谜。