问题描述
我习惯在顶级的Gnome面板中进行系统监控:CPU,温度,净值Fan-Speed。 (见下面的截图)

在Unity中,顶部面板锁定窗口名称和全局菜单,所以我无法添加面板小程序。所以我的问题是:
有没有办法在Unity中替换这种系统监控(始终可见,占用的空间不多)?
最佳解决办法
完全像旧的侏儒指标:http://www.webupd8.org/2011/05/network-memory-and-cpu-usage-indicator.html#more
链接注意:安装完成后,从Dash启动系统负载指示器。与旧的侏儒applet不同,这是如何将这些指标添加到面板。
次佳解决办法
我发现下面的问题和答案,为我解决了这个问题。它包含一个名为应用程序指示器的旧applet的替换列表。不幸的是,并不是所有这些设备都可用,但至少我有一个非常基本的系统负载监视器(indicator-sysmonitor)和一个天气指示器(indicator-weather)。

点击按钮进行安装:

第三种解决办法
这是一个快速和肮脏的系统监视器,我一起从python入侵:

它使用“System Monitor Indicator”(here)来调用我编写的脚本。要使用它:
-
安装
indicator-sysmonitor。为此,请运行以下命令:sudo apt-add-repository ppa:alexeftimie/ppa && sudo apt-get update && sudo apt-get install indicator-sysmonitor -
将以下脚本复制到一个名为sysmonitor的文件中
-
使脚本可执行(
chmod +x path-to-file) -
点击指标并选择”Preferences”。
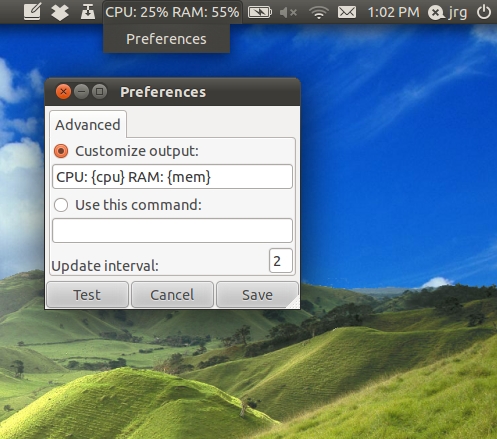
-
选择“使用此命令”并为其指定sysmonitor文件的路径。

代码如下:
#!/usr/bin/python

import re
import sys
import time
import psutil


#Functions:_    __    __    __    __    __    __    __    __    __    __    __
#__/  \__/  \__/  \__/  \__/  \__/  \__/  \__/  \__/  \__/  \__/  \__/  \__/  \_


#interface |bytes    packets errs drop fifo frame compressed multicast|bytes    packets errs drop fifo colls carrier compressed
net_re = re.compile(r"\s*\S+:\s+(\d+)\s+\d+\s+\d+\s+\d+\s+\d+\s+\d+\s+\d+\s+\d+\s+(\d+)\s+\d+\s+\d+\s+\d+\s+\d+\s+\d+\s+\d+\s+\d+\s+")

def getInOut():
  """
  Get a readout of bytes in and out from /proc/net/dev.
  """

  netfile = "/proc/net/dev"

  try: f = open(netfile)
  except:
    sys.stderr.write("ERROR: can't open "+netfile+".\n")
    sys.exit(2)

  f.readline()    #Burn the top header line.
  f.readline()    #Burn the second header line.

  inb = 0
  outb = 0
  for line in f:
    m = net_re.match(line)
    inb += int(m.group(1))
    outb += int(m.group(2))
  f.close()

  return (inb,outb)


def sampleNet():
  """
  Get a sample of I/O from the network interfaces.
  """
  return makeSample(getInOut)


def makeSample(function):
  inlist = list()
  outlist = list()

  (inbytes, outbytes) = function()
  inlist.append(inbytes)
  outlist.append(outbytes)
  time.sleep(1)

  (inbytes, outbytes) = function()
  inlist.append(inbytes)
  outlist.append(outbytes)

  return (inlist[1] - inlist[0], outlist[1] - outlist[0])


def diskstatWrapper():
  """
  Wrapper for the diskstats_parse function that returns just the in and out.
  """
  ds = diskstats_parse("sda")
  return (ds["sda"]["writes"], ds["sda"]["reads"])


def sampleDisk():
  """
  Get a sample of I/O from the disk.
  """
  return makeSample(diskstatWrapper)


def diskstats_parse(dev=None):
    """
    I found this on stackoverflow.
    (http://stackoverflow.com/questions/3329165/python-library-for-monitoring-proc-diskstats)
    """
    file_path = '/proc/diskstats'
    result = {}

    # ref: http://lxr.osuosl.org/source/Documentation/iostats.txt
    columns_disk = ['m', 'mm', 'dev', 'reads', 'rd_mrg', 'rd_sectors',
                    'ms_reading', 'writes', 'wr_mrg', 'wr_sectors',
                    'ms_writing', 'cur_ios', 'ms_doing_io', 'ms_weighted']

    columns_partition = ['m', 'mm', 'dev', 'reads', 'rd_sectors', 'writes', 'wr_sectors']

    lines = open(file_path, 'r').readlines()
    for line in lines:
        if line == '': continue
        split = line.split()
        if len(split) != len(columns_disk) and len(split) != len(columns_partition):
            # No match
            continue

        data = dict(zip(columns_disk, split))
        if dev != None and dev != data['dev']:
            continue
        for key in data:
            if key != 'dev':
                data[key] = int(data[key])
        result[data['dev']] = data

    return result


#MAIN:    __    __    __    __    __    __    __    __    __    __    __    __
#__/  \__/  \__/  \__/  \__/  \__/  \__/  \__/  \__/  \__/  \__/  \__/  \__/  \_


(indiff, outdiff) = sampleNet()
outstr = ""
outstr += "cpu: "+str(int(psutil.cpu_percent()))+"%\t"
outstr += "net: "+str(indiff/1000)+"|"+str(outdiff/1000)+" K/s\t"

(diskin, diskout) = sampleDisk()
outstr += "disk: "
if(diskin):
  outstr += "+"
else:
  outstr += "o"
outstr += "|"
if(diskout):
  outstr += "+"
else:
  outstr += "o"

print outstr
编辑:如果你想要内存使用(作为由”top”报告)添加行
memperc = int(100*float(psutil.used_phymem())/float(psutil.TOTAL_PHYMEM))
outstr += "mem: "+str(memperc)+"%\t"
如果您有psutil的2.0版本,那么您可以通过以下行获得GNOME系统监视器报告的内存使用情况:
memperc = int(100*float(psutil.used_phymem()-psutil.cached_phymem())/float(psutil.TOTAL_PHYMEM))
如果你的空间很小,并且你希望有净速度单位(b,k,M),你也可以使用它
def withUnit(v):
    if v<1024:
      return "%03d" % v+"b";
    if v<1024**2:
      s= ("%f" % (float(v)/1024))[:3];
      if s[-1]=='.':
         s=s[:-1]
      return s +"k";

    return ("%f" % (float(v)/(1024**2)))[:3] +"M";


(indiff, outdiff) = sampleNet()
outstr = ""
outstr += "c"+ "%02d" % int(psutil.cpu_percent())+" "
outstr += "m"+ "%02d" % int((100*float(psutil.used_phymem())/float(psutil.TOTAL_PHYMEM)))+" "

outstr += "d"+withUnit(indiff)+" u"+withUnit(outdiff)
第四种办法
您可以从中下载并安装软件包(.deb)
https://launchpad.net/indicator-sysmonitor/+download在这里。安装后,您可以在“应用程序>”下找到它。配件> Sysyem Monitor Indicator,它在Unity中看起来像这样;

第五种办法
我认为这个问题是:https://gist.github.com/982939
截图:

第六种办法
有人在indicator-applet的硬件传感器上工作。参见Is there a hardware temperature sensor indicator?
第七种办法
您可以从https://launchpad.net/~indicator-multiload/+archive/stable-daily安装gnome系统监视器指示器的端口
第八种办法
它不在顶部面板中,但可以使用Conky。
我不使用Conky,但有一些苗条的主题,我认为你可以将它永远放在最前面。 (尽管我不知道屏幕的哪一部分可以很好地覆盖……)
第九种办法
我认为这将是目前最接近它的事情。 Cpu monitor